River
Bubye River
1,010 km from source to mouth · Zimbabwe.
 ZimbabweFlows into Limpopo River1st longest in Zimbabwe
In numbers
Length
1,010km
Average flow
140m³/s
Basin
232,707km²
Drop
1,254m
from 1,479 m to 225 m
Country
1
The journey
From source to mouth
1,010 km of river and 7 stops on the way: 6 towns and cities on its banks, dams, bridges and the tributaries that feed it.
- 0 kmSourceat 1,479 m
- 0 kmEdenvale49,292 people
- 4 kmAlexandra179,624 people
- 30 kmDiepsloot350,000 people
- 65 kmHartbeespoort26,732 people
- 66 kmHartbeespoort Reservoir17 km²
- 79 kmBrits122,497 people
- 830 kmBeitbridge58,574 people
- 1,010 kmLimpopo Riverat 225 m
Water level along the river (RiverATLAS; the height is exaggerated). Towns: GeoNames and Wikidata; bridges, dams and tributaries: Wikidata.
River in Zimbabwe
At the mouth it carries 137 m³/s on average: an Olympic pool every 18 seconds. It drops from 1,479 m to 225 m, 1.2 m per kilometre on average. Its basin covers 232,707 km², about the size of UG. 10.9 million people live in it. Highest water: from February to March; lowest: from July to October. Dams and reservoirs hold back a large share of its water (48% of a year's flow).
Where to start
- DiepslootLargest city on its banks · 350,000 people
- Lanseria International Airport (HLA)Nearest airport with scheduled flights, 9 km from the cityCar hire at HLA airport (Johannesburg)Discover Cars · Affiliate link↗
- On the water2 ferry piers, marinas, boat rentals and boat ramps along the river (OpenStreetMap)
- From April to AugustThe best months to visit
Bubye River, month by month
Highest water: from February to March
Lowest water: from July to October. Best months to visit: from April to August.
From about 22 m³/s in the lowest month to 710 m³/s in the highest. An estimate: the monthly flow is modelled from the lowest and highest months of WaterGAP (RiverATLAS, 1971–2000) and the rain and snow along the river (WorldClim). Dams change the real rhythm. The chip is the average air temperature; below it, the month's rain.
Plan the trip
Plan the trip: boat trips, a bed by the river, a car
Some links above are affiliate links: if you book through them we may earn a commission, at no extra cost to you. It never changes what the data on this page says.
The basin
Bubye River: the basin in numbers
232,707 km² of land send their water to this river. This is what lives on it.
- 10.9millionpeople live in the basin
- 47/km²people per km²
- 994maverage altitude of the basin
- 493mmof rain a year (basin average)
- 20.0°Caverage air temperature
- 10%protected areas
- 0.2%covered by lakes
- 2.1km³held in reservoirs
What covers the basin
- 22% Forest
- 12% Cropland
- 45% Pasture
- 2% Towns and cities
RiverATLAS (HydroATLAS v1.0, CC BY 4.0): land cover, people, protected areas, glaciers and dams over the whole basin upstream of the mouth.
Along the river
Bubye River: what you find on the way
- 77WeirsHarry's Camp weir, Weir east of Harry's Camp, Gansies Dam and 74 more
- 8Locks
- 2Boat ramps
From OpenStreetMap, within 2.6 km of the river. Not mapped is not the same as not there.
Cross-checked with our atlases
Bubye River in our other atlases
What our sister atlases know about the waterfalls on this river, the lakes it flows through, the beaches at its mouth, the mountains where it rises and the islands off its mouth.
 1lake on its wayLakeyas
Lakes and reservoirs (1)
Lakes it flows through, by Lakeyas
- Hartbeespoort Reservoirkm 6617km²
Lakeyas is coming soonOpen Lakeyas ↗
From space
The source and the mouth, seen from orbit
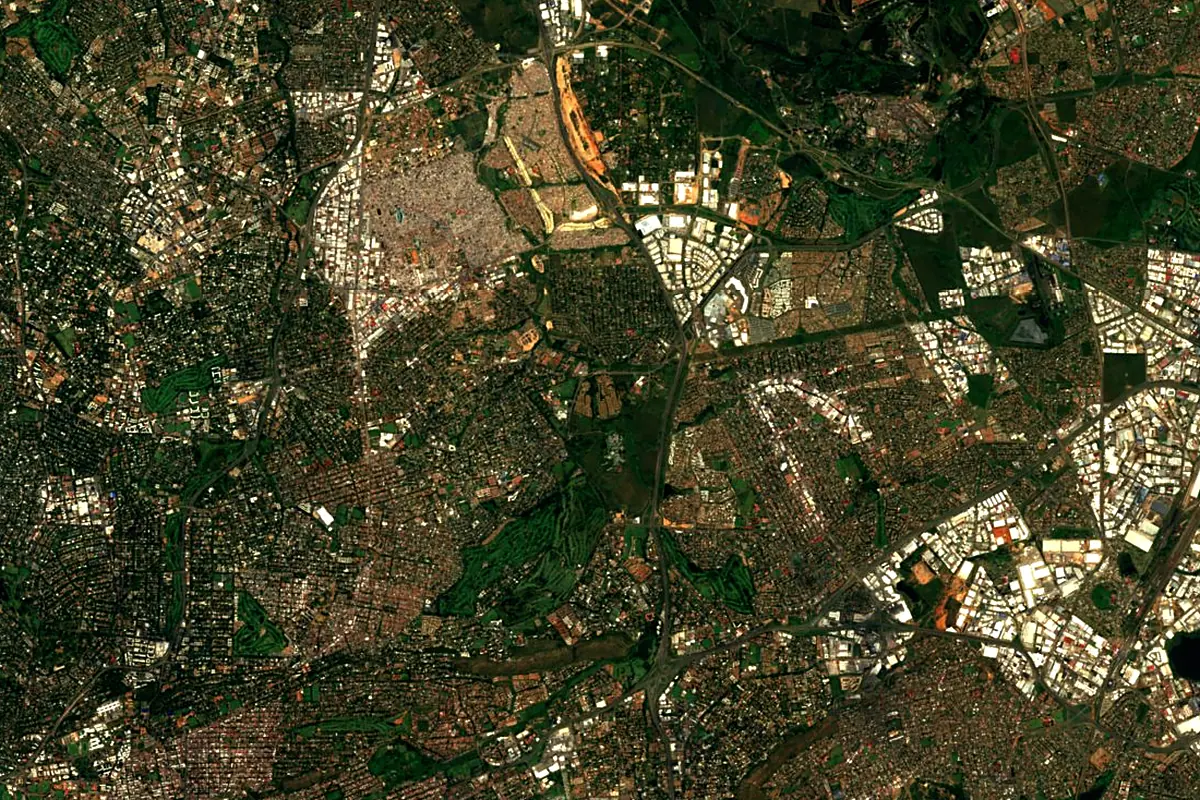
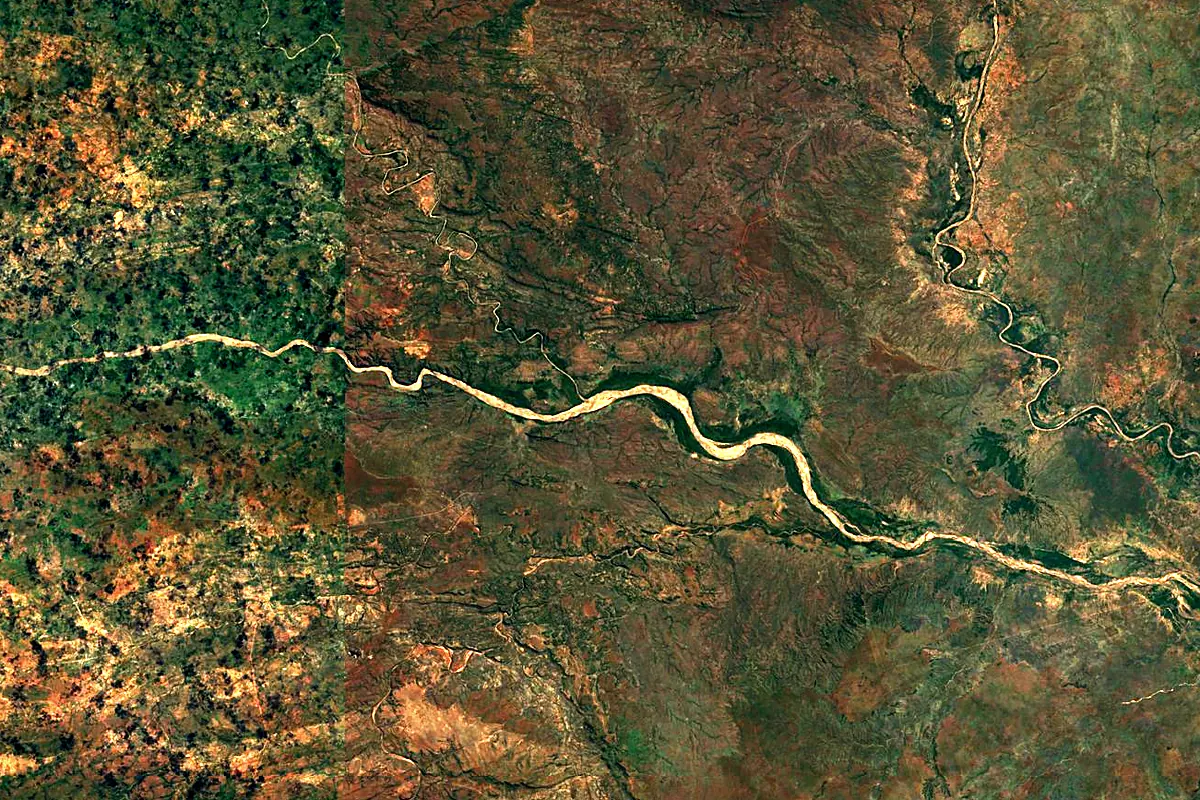
Sentinel-2 cloudless 2016 by EOX IT Services GmbH (contains modified Copernicus Sentinel data 2016), CC BY 4.0. The glowing line is the river as drawn by RiverATLAS.
Tributaries
Where it flows, and what flows into it
It flows into
Limpopo River Mozambique1,750 km170 m³/s
 Botswana
Nearby
Rivers nearby
Zimbabwe300 km21 m³/s182 km awayRunde RiverZimbabwe418 km140 m³/s175 km awayOlifants River (Limpopo) South Africa560 km110 m³/s252 km awayKomati RiverMozambique480 km110 m³/s415 km awaySave RiverMozambique400 km910 m³/s435 km awayPungwe RiverMozambique400 km320 m³/s463 km awayBuzi RiverMozambique250 km79 m³/s463 km awayMaputo RiverMozambique300 km110 m³/s473 km away
Where these numbers come from
| Name, length, places | Wikidata (Q2812424) · CC0 |
|---|---|
| Course, profile, basin | RiverATLAS v1.0 (HydroATLAS, Linke et al. 2019) · CC BY 4.0 — followed along the river network from the point given by Wikidata |
| Flow | WaterGAP (RiverATLAS), 1971–2000 · CC BY 4.0 |
| Climate along the river | WorldClim (RiverATLAS), 1970–2000 · CC BY 4.0 |
| Towns, bridges, dams | Wikidata · CC0; GeoNames · CC BY 4.0 |
| Along the river | © OpenStreetMap contributors · ODbL |
| Images | EOX Sentinel-2 cloudless 2016 · CC BY 4.0; Wikimedia Commons |
| Our other atlases | Lakeyas — Wikidata · CC0; © OpenStreetMap contributors · ODbL; GeoNames · CC BY 4.0; HydroLAKES · CC BY 4.0; NOAA OISST |
Every source and licence is on the data sources page.
The family
Do you prefer beaches, lakes, mountains, waterfalls, islands, rivers or canyons?
Same idea, other landscapes: field atlases built on open data, month by month, in seven languages.
 beaches
 Find your beach: sea temperature, sun and swimming month by month.Visit lakes
 Every lake on Earth: water temperature, ice, depth and the shore.Coming soonVisit
  mountains
 Every summit in 3D: summit weather, the 0 °C line, huts and trails.Visit
  waterfalls
 Every waterfall: height, flow month by month and when it roars.Coming soonVisit
  islands
 Every island from the sea up: size, sea temperature, ferries and 3D.Coming soonVisit
  rivers
 Every river from source to sea: the journey, the flow and the basin in numbers.You are here
 canyons
 Every canyon cut to scale: depth to the floor, rim and floor temperatures, trails and viewpoints.Coming soonVisit