River
Wu River
1,150 km from source to mouth · China.
 ChinaFlows into Yangtze River
In numbers
Length
1,150km
Average flow
1,800m³/s
Basin
80,200km²
Drop
1,857m
from 1,991 m to 134 m
Country
1
The journey
From source to mouth
1,150 km of river and 34 stops on the way: 13 towns and cities on its banks, dams, bridges and the tributaries that feed it.
- 0 kmSourceat 1,991 m
- 299 kmNajiehe Railway Bridge
- 300 kmLiuchong Rivertributary
- 306 kmYachi River Bridge
- 330 kmYachi Railway Bridge
- 355 kmLiuguanghe Bridge
- 371 kmLiuguanghe Xiqian Expressway Bridge
- 432 kmWujiangdu reservoir32 km²
- 434 kmWujiang Viaduct
- 436 kmZunyi Bridge
- 443 kmpipeline bridge between Zunyi and Guiyang
- 495 kmXiang Rivertributary
- 517 kmQingshuihe Rivertributary
- 545 kmJiangjiehe Bridge
- 545 kmJiangjiehe Railway Bridge
- 573 kmWujiang Bridge Yuqing
- 648 kmDeyu Expressway Wu River Bridge
- 835 kmWanmu15,220 people
- 891 kmGongtan17,248 people
- 923 kmLujiao9,519 people
- 941 kmWujiang Bridge Mozhai
- 949 kmHanjia108,430 people
- 955 kmYu Rivertributary
- 968 kmGaogu15,522 people
- 1,003 kmJiangkou20,829 people
- 1,020 kmWulong78,225 people
- 1,032 kmTukan8,128 people
- 1,041 kmYangjiao14,659 people
- 1,049 kmBaima25,629 people
- 1,070 kmBaitao46,160 people
- 1,093 kmCategory:Lizhi Wujiang Bridge
- 1,096 kmFuling Arch Bridge
- 1,099 kmLizhi156,753 people
- 1,099 kmFuling268,658 people
- 1,099 kmFuling Wujiang Bridge
- 1,150 kmYangtze Riverat 134 m
Water level along the river (RiverATLAS; the height is exaggerated). Towns: GeoNames and Wikidata; bridges, dams and tributaries: Wikidata.
Tributary of the Yangtze in China
At the mouth it carries 1,800 m³/s on average: an Olympic pool every 1.4 seconds. It drops from 1,991 m to 134 m, 1.6 m per kilometre on average. Its basin covers 80,200 km², about the size of CZ. 21.0 million people live in it. Highest water: from June to July; lowest: from December to March. Its dams hold back little of its water (9.0% of a year's flow).
Where to start
- FulingLargest city on its banks · 268,658 people
- Chongqing Xiannüshan Airport (CQW)Nearest airport with scheduled flights, 40 km from the city
- On the water16 ferry piers, marinas, boat rentals and boat ramps along the river (OpenStreetMap)
- From March to April and from September to NovemberThe best months to visit
Wu River, month by month
Highest water: from June to July
Lowest water: from December to March. Best months to visit: from March to April and from September to November.
From about 540 m³/s in the lowest month to 3,400 m³/s in the highest. An estimate: the monthly flow is modelled from the lowest and highest months of WaterGAP (RiverATLAS, 1971–2000) and the rain and snow along the river (WorldClim). Dams change the real rhythm. The chip is the average air temperature; below it, the month's rain.
Plan the trip
Plan the trip: boat trips, a bed by the river, a car
Some links above are affiliate links: if you book through them we may earn a commission, at no extra cost to you. It never changes what the data on this page says.
The basin
Wu River: the basin in numbers
86,799 km² of land send their water to this river. This is what lives on it.
- 21.0millionpeople live in the basin
- 242/km²people per km²
- 1,130maverage altitude of the basin
- 1,203mmof rain a year (basin average)
- 14.6°Caverage air temperature
- 8%protected areas
- 0.2%covered by lakes
- 4.8km³held in reservoirs
What covers the basin
- 41% Forest
- 28% Cropland
- 54% Pasture
- 6% Towns and cities
RiverATLAS (HydroATLAS v1.0, CC BY 4.0): land cover, people, protected areas, glaciers and dams over the whole basin upstream of the mouth.
Along the river
Wu River: what you find on the way
- 5Locks
- 2Boat ramps
- 9Ferry piersZhongzui Ferry Terminal and 8 more
- 5Marinas
From OpenStreetMap, within 2.4 km of the river. Not mapped is not the same as not there.
Cross-checked with our atlases
Wu River in our other atlases
What our sister atlases know about the waterfalls on this river, the lakes it flows through, the beaches at its mouth, the mountains where it rises and the islands off its mouth.
 1lake on its wayLakeyas
Lakes and reservoirs (1)
Lakes it flows through, by Lakeyas
- Wujiangdu reservoirkm 37432km²
Lakeyas is coming soonOpen Lakeyas ↗
From space
The source and the mouth, seen from orbit
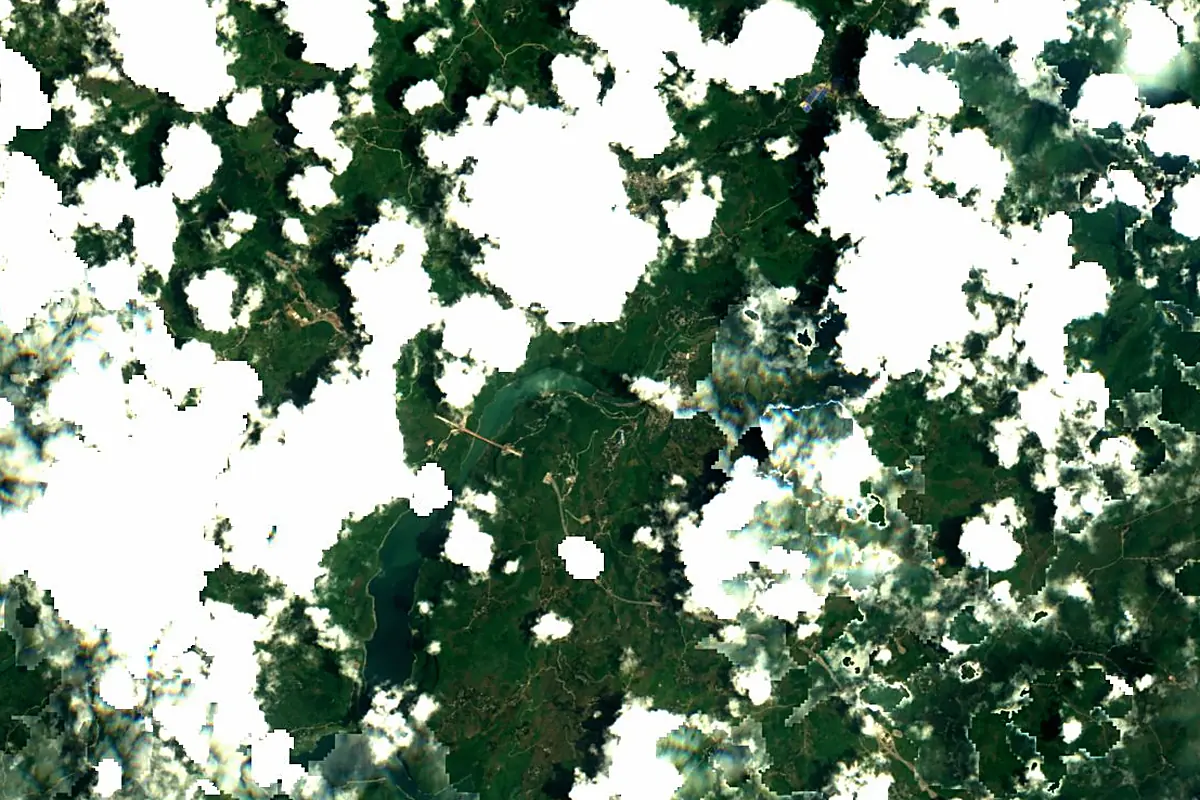
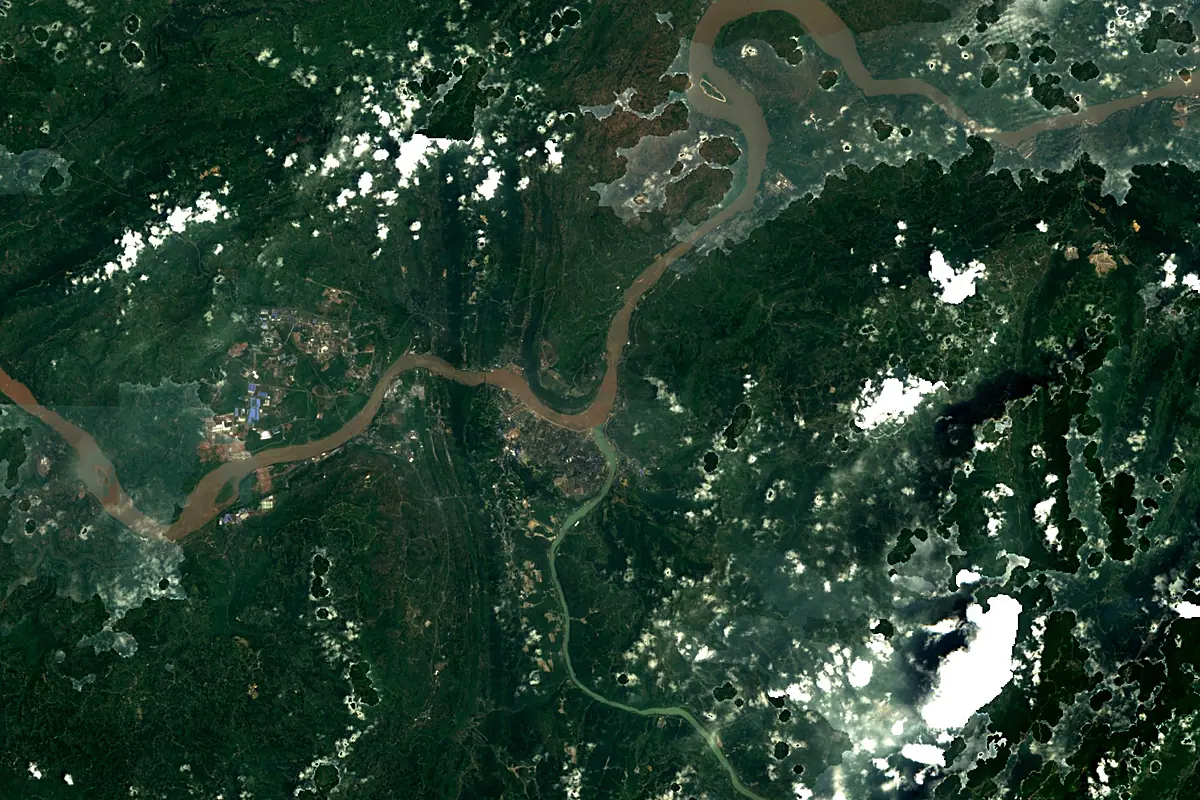
Sentinel-2 cloudless 2016 by EOX IT Services GmbH (contains modified Copernicus Sentinel data 2016), CC BY 4.0. The glowing line is the river as drawn by RiverATLAS.
Photos
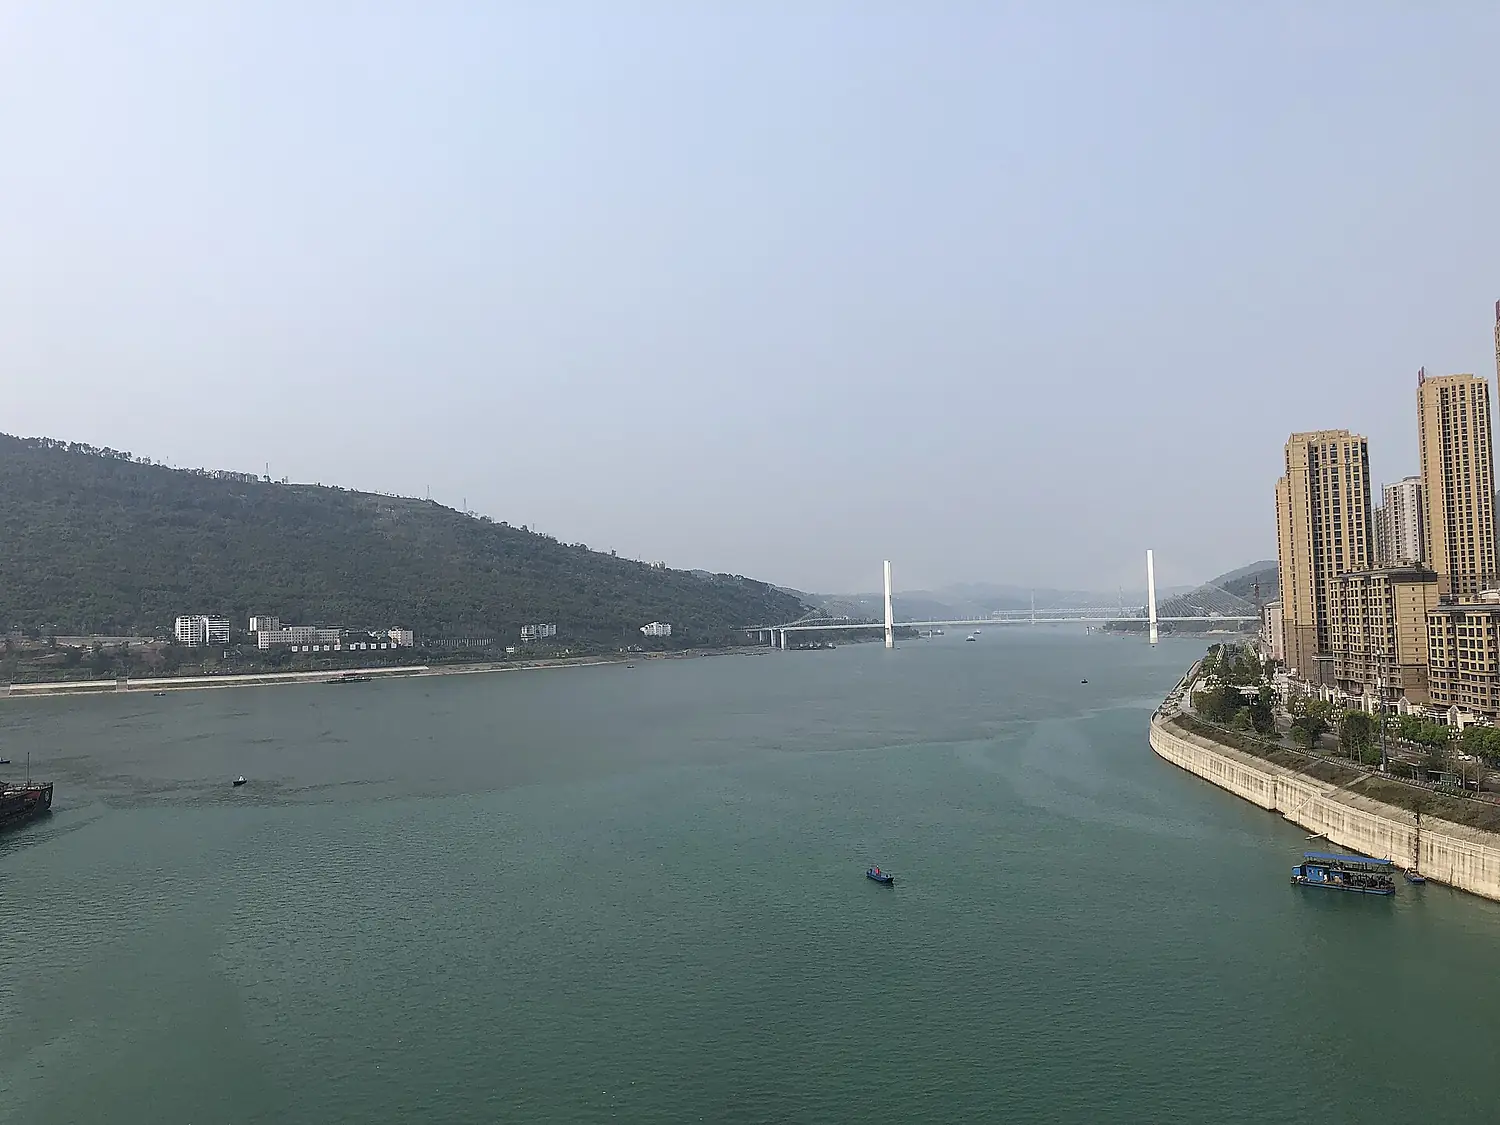
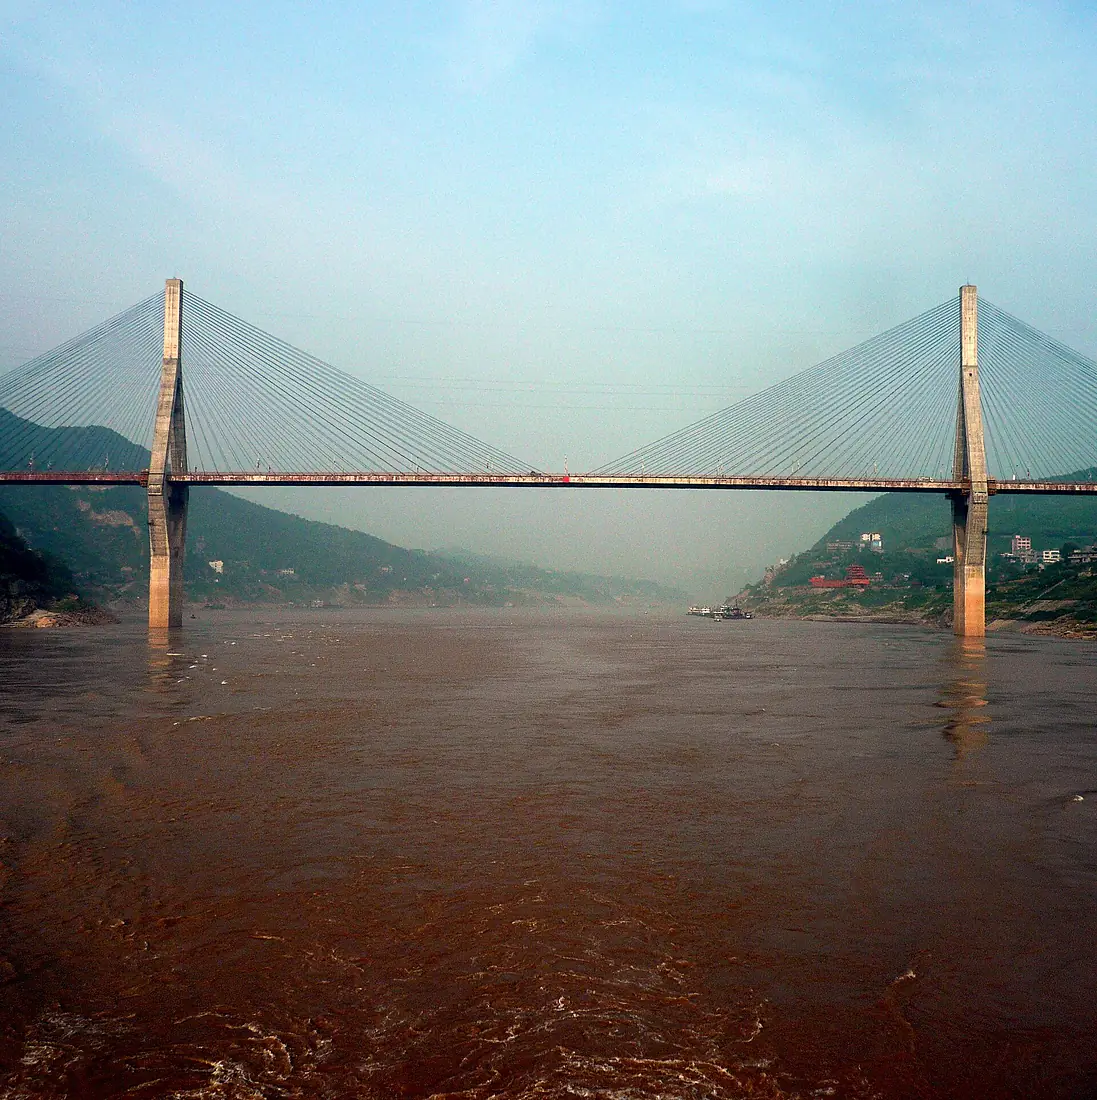
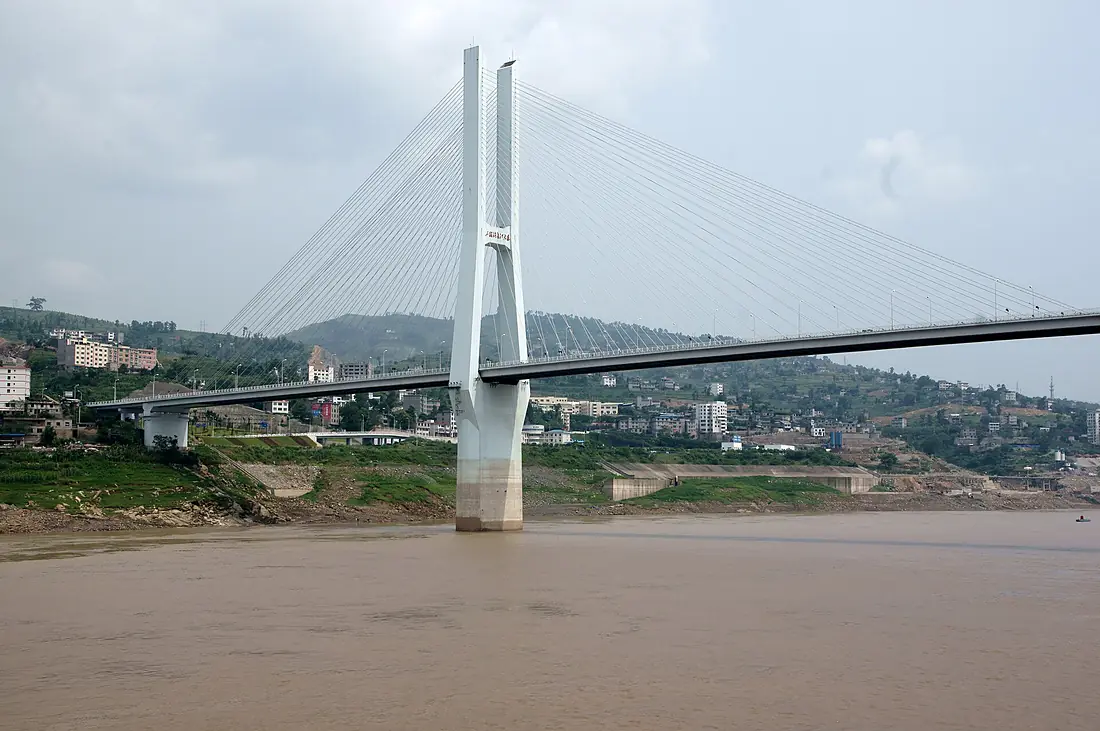
Wu River in pictures
Tributaries
Where it flows, and what flows into it
It flows into
Yangtze RiverChina6,300 km31,900 m³/sTributaries (8)
Also: Liuchong River, Qingshuihe River, Xiang River, Yu River, Furong River, Yinjiang He, Daxi He, Hongdu He
In the same basin
China1,532 km2,200 m³/sHuai RiverChina1,110 km1,200 m³/sYalong RiverChina1,323 km2,000 m³/sGan RiverChina758 km1,700 m³/sJialing RiverChina1,119 km2,100 m³/sXiang RiverChina801 km6,400 m³/sMin RiverChina711 km2,300 m³/sYuan RiverChina993 km2,000 m³/sDadu RiverChina642 km1,400 m³/sJinsha RiverChina3,005 km4,500 m³/sWhere these numbers come from
| Name, length, places | Wikidata (Q1515792) · CC0 |
|---|---|
| Course, profile, basin | RiverATLAS v1.0 (HydroATLAS, Linke et al. 2019) · CC BY 4.0 — followed along the river network from the point given by Wikidata |
| Flow | WaterGAP (RiverATLAS), 1971–2000 · CC BY 4.0 |
| Climate along the river | WorldClim (RiverATLAS), 1970–2000 · CC BY 4.0 |
| Towns, bridges, dams | Wikidata · CC0; GeoNames · CC BY 4.0 |
| Along the river | © OpenStreetMap contributors · ODbL |
| Images | EOX Sentinel-2 cloudless 2016 · CC BY 4.0; Wikimedia Commons |
| Our other atlases | Lakeyas — Wikidata · CC0; © OpenStreetMap contributors · ODbL; GeoNames · CC BY 4.0; HydroLAKES · CC BY 4.0; NOAA OISST |
Every source and licence is on the data sources page.
The family
Do you prefer beaches, lakes, mountains, waterfalls, islands, rivers or canyons?
Same idea, other landscapes: field atlases built on open data, month by month, in seven languages.
 beaches
 Find your beach: sea temperature, sun and swimming month by month.Visit lakes
 Every lake on Earth: water temperature, ice, depth and the shore.Coming soonVisit
  mountains
 Every summit in 3D: summit weather, the 0 °C line, huts and trails.Visit
  waterfalls
 Every waterfall: height, flow month by month and when it roars.Coming soonVisit
  islands
 Every island from the sea up: size, sea temperature, ferries and 3D.Coming soonVisit
  rivers
 Every river from source to sea: the journey, the flow and the basin in numbers.You are here
 canyons
 Every canyon cut to scale: depth to the floor, rim and floor temperatures, trails and viewpoints.Coming soonVisit