River
Vaal River
1,120 km from source to mouth · South Africa.
 South AfricaFlows into Orange River2nd longest in South Africa
In numbers
Length
1,120km
Average flow
120m³/s
Basin
196,438km²
Drop
703m
from 1,680 m to 977 m
Country
1
The journey
From source to mouth
1,120 km of river and 26 stops on the way: 10 towns and cities on its banks, dams, bridges and the tributaries that feed it.
- 0 kmSourceat 1,680 m
- 64 kmPaul Kruger bridge
- 145 kmGrootdraai Dam
- 146 kmGrootdraai Dam Reservoir38 km²
- 149 kmStanderton101,101 people
- 241 kmVilliers20,745 people
- 272 kmWilge Rivertributary
- 311 kmDeneysville23,337 people
- 312 kmVaal Dam Reservoir288 km²
- 312 kmVaal Dam
- 340 kmKlip Rivertributary
- 342 kmVereeniging474,681 people
- 372 kmVaal Barrage
- 411 kmParys71,319 people
- 478 kmMooi Rivertributary
- 496 kmRenoster Rivertributary
- 522 kmOrkney110,052 people
- 644 kmSandspruit Rivertributary
- 712 kmBloemhof Reservoir164 km²
- 713 kmBloemhof Dam
- 714 kmBloemhof33,432 people
- 764 kmChristiana25,019 people
- 806 kmWarrenton17,946 people
- 896 kmBarkly West11,621 people
- 934 kmHarts Rivertributary
- 1,027 kmRiet Rivertributary
- 1,034 kmDouglas Weir
- 1,120 kmOrange Riverat 977 m
Water level along the river (RiverATLAS; the height is exaggerated). Towns: GeoNames and Wikidata; bridges, dams and tributaries: Wikidata.
River in South Africa
At the mouth it carries 125 m³/s on average: an Olympic pool every 20 seconds. It drops from 1,680 m to 977 m, 0.6 m per kilometre on average. Its basin covers 196,438 km², about the size of SN. 11.1 million people live in it. Highest water: from January to March; lowest: from July to October. It is heavily dammed: reservoirs can hold 151% of a year's flow.
Where to start
- VereenigingLargest city on its banks · 474,681 people
- O.R. Tambo International Airport (JNB)Nearest airport with scheduled flights, 67 km from the cityCar hire at JNB airport (Johannesburg)Discover Cars · Affiliate link↗
- On the water17 ferry piers, marinas, boat rentals and boat ramps along the river (OpenStreetMap)
- From April to May and from September to NovemberThe best months to visit
Vaal River, month by month
Highest water: from January to March
Lowest water: from July to October. Best months to visit: from April to May and from September to November.
From about 54 m³/s in the lowest month to 450 m³/s in the highest. An estimate: the monthly flow is modelled from the lowest and highest months of WaterGAP (RiverATLAS, 1971–2000) and the rain and snow along the river (WorldClim). Dams change the real rhythm. The chip is the average air temperature; below it, the month's rain.
Plan the trip
Plan the trip: boat trips, a bed by the river, a car
Some links above are affiliate links: if you book through them we may earn a commission, at no extra cost to you. It never changes what the data on this page says.
The basin
Vaal River: the basin in numbers
185,500 km² of land send their water to this river. This is what lives on it.
- 11.1millionpeople live in the basin
- 60/km²people per km²
- 1,441maverage altitude of the basin
- 580mmof rain a year (basin average)
- 16.2°Caverage air temperature
- 1%protected areas
- 0.5%covered by lakes
- 8.8km³held in reservoirs
What covers the basin
- 26% Cropland
- 54% Pasture
- 2% Towns and cities
RiverATLAS (HydroATLAS v1.0, CC BY 4.0): land cover, people, protected areas, glaciers and dams over the whole basin upstream of the mouth.
Along the river
Vaal River: what you find on the way
- 12WeirsDouglas Weir and 11 more
- 1WaterfallsGong Gong Waterfall
- 14Boat rampsAlbatros Ski Club, Vosloopark Jetti, Soet Dorings Slipway and 11 more
- 3MarinasManten Marine, Anchor Creek Marina, Vaal River Boating Club
From OpenStreetMap, within 2.6 km of the river. Not mapped is not the same as not there.
Cross-checked with our atlases
Vaal River in our other atlases
What our sister atlases know about the waterfalls on this river, the lakes it flows through, the beaches at its mouth, the mountains where it rises and the islands off its mouth.
 3lakes on its wayLakeyas
Lakes and reservoirs (3)
Lakes it flows through, by Lakeyas
- Grootdraai Dam Reservoirkm 16738km²
- Vaal Dam Reservoirkm 358288km²
- Bloemhof Reservoirkm 819164km²
Lakeyas is coming soonOpen Lakeyas ↗
From space
The source and the mouth, seen from orbit
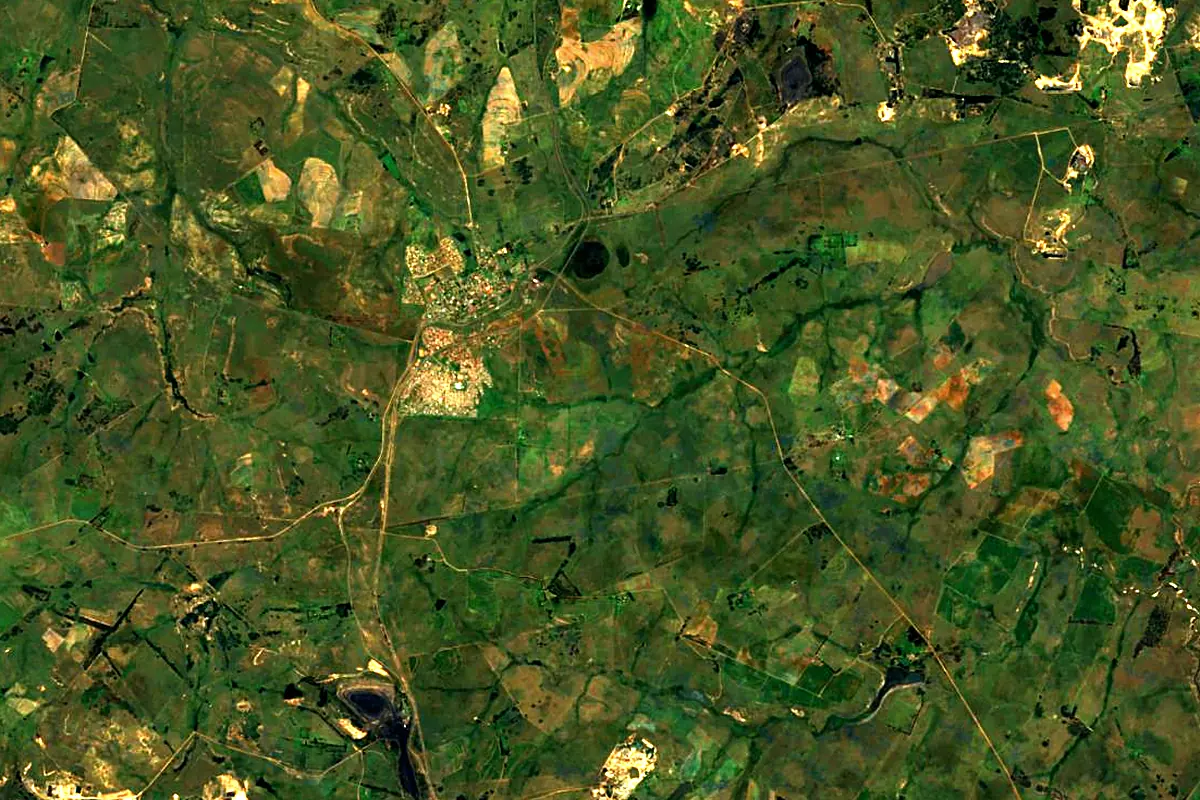
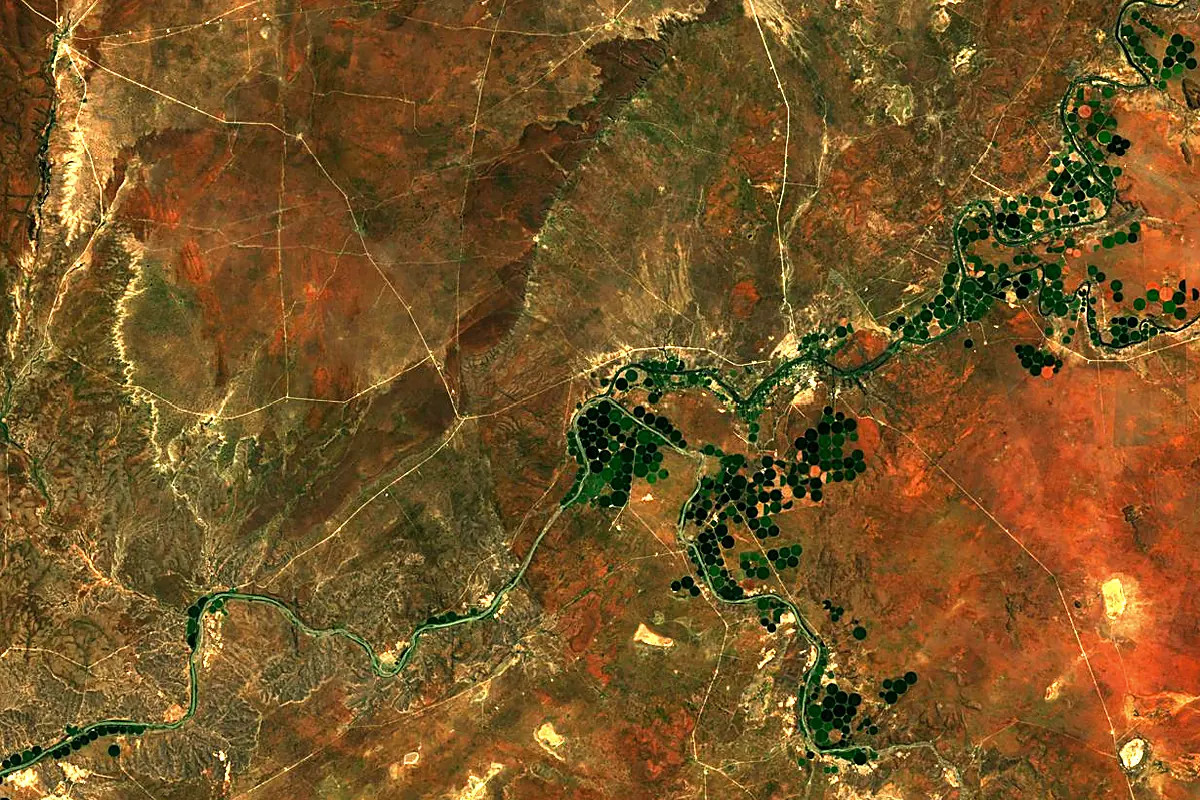
Sentinel-2 cloudless 2016 by EOX IT Services GmbH (contains modified Copernicus Sentinel data 2016), CC BY 4.0. The glowing line is the river as drawn by RiverATLAS.
Photos
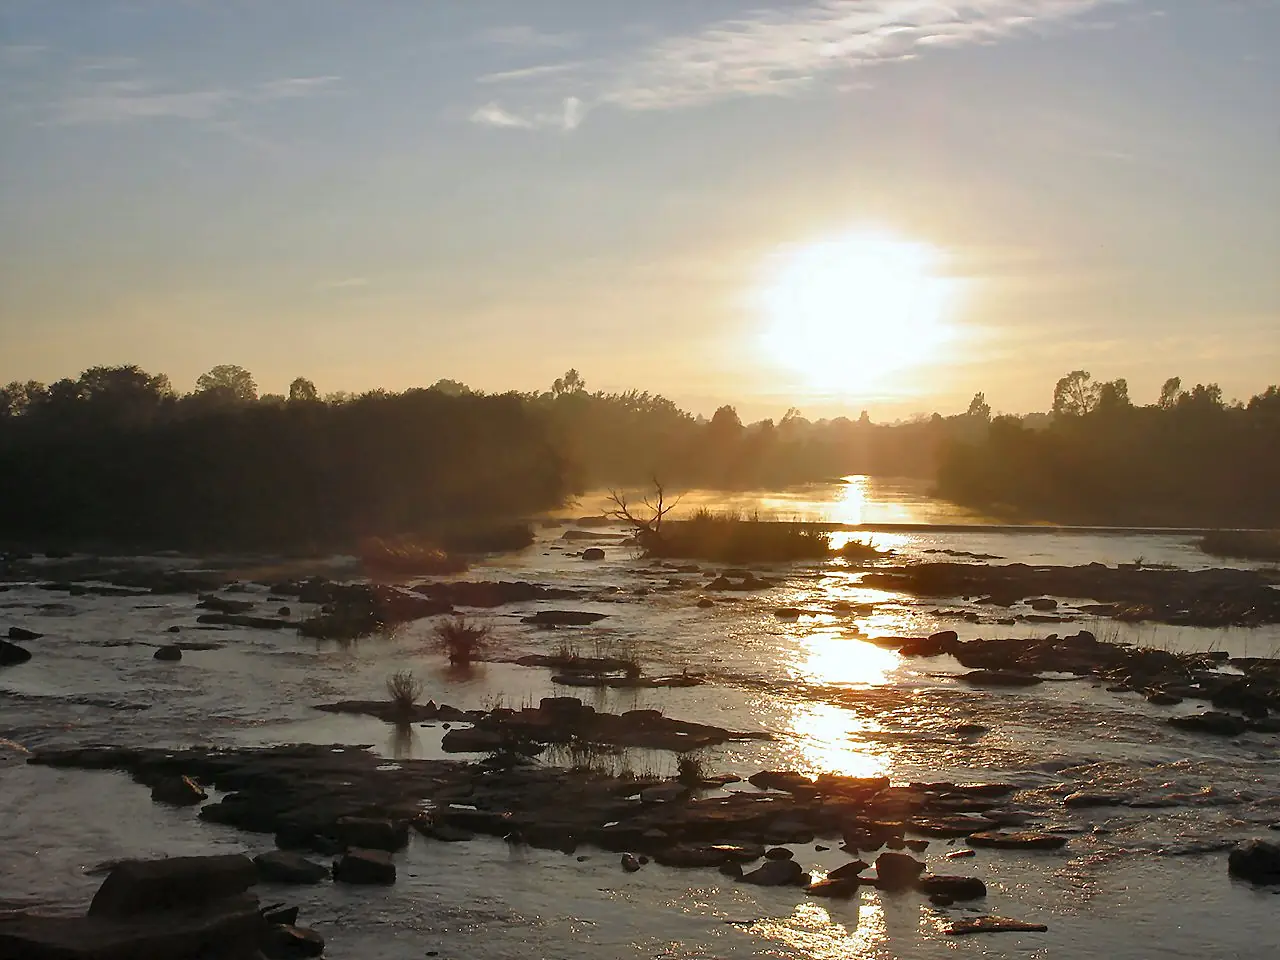
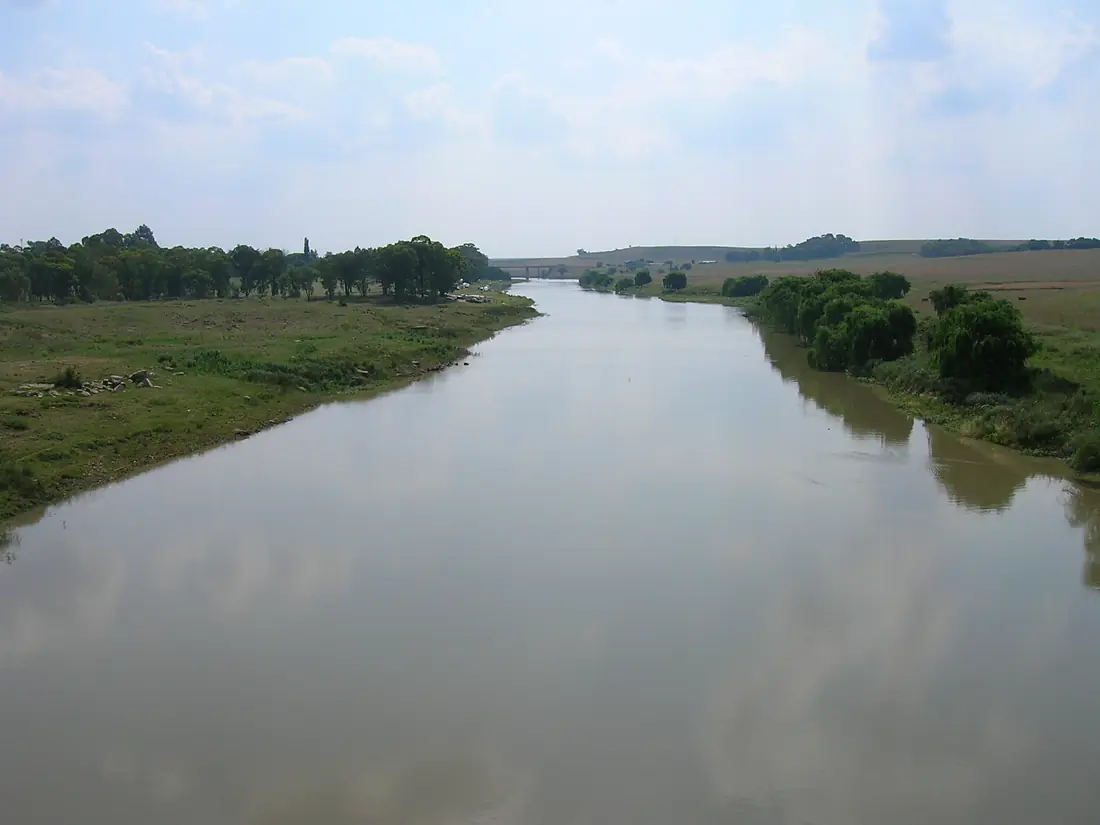
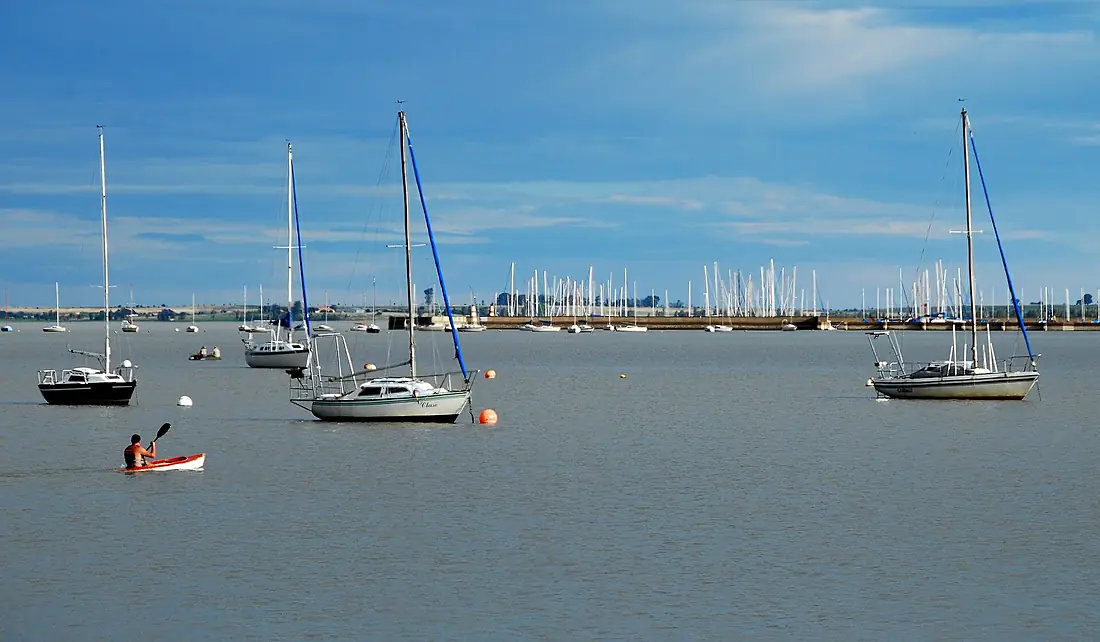
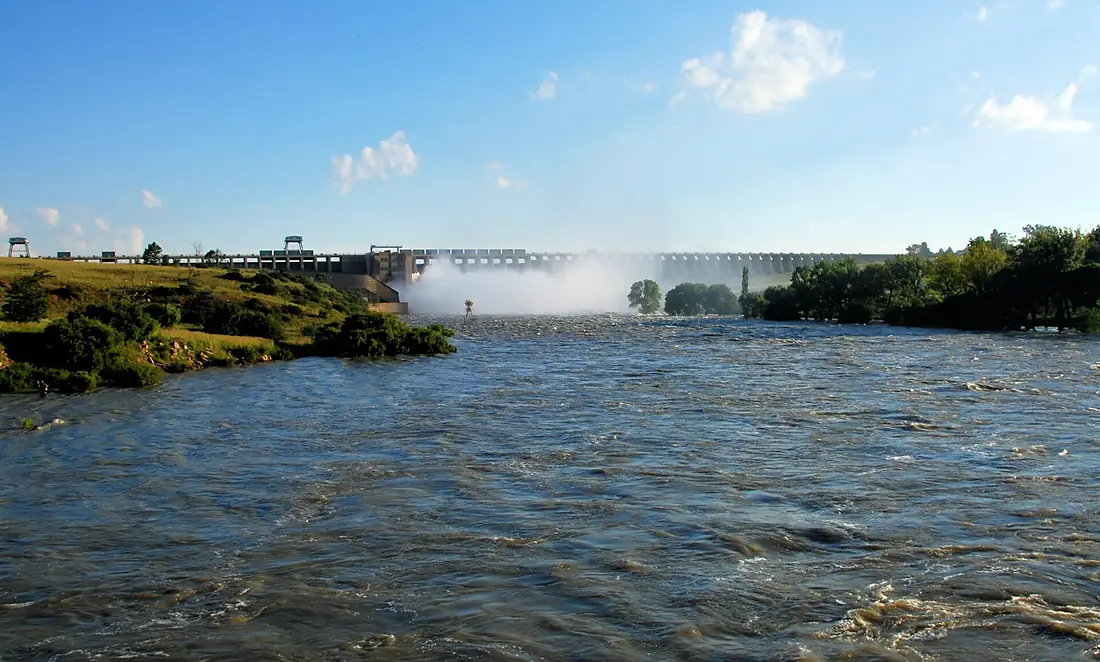
Vaal River in pictures
Tributaries
Where it flows, and what flows into it
It flows into
Orange RiverSouth Africa2,200 km800 m³/sTributaries (9)
Also: Riet River, Wilge River, Harts River, Vet River, Klip River, Vals River, Mooi River, Renoster River, Sandspruit River
 Namibia
 Lesotho
Where these numbers come from
| Name, length, places | Wikidata (Q209530) · CC0 |
|---|---|
| Course, profile, basin | RiverATLAS v1.0 (HydroATLAS, Linke et al. 2019) · CC BY 4.0 — followed from the source to the mouth given by Wikidata |
| Flow | WaterGAP (RiverATLAS), 1971–2000 · CC BY 4.0 |
| Climate along the river | WorldClim (RiverATLAS), 1970–2000 · CC BY 4.0 |
| Towns, bridges, dams | Wikidata · CC0; GeoNames · CC BY 4.0 |
| Along the river | © OpenStreetMap contributors · ODbL |
| Images | EOX Sentinel-2 cloudless 2016 · CC BY 4.0; Wikimedia Commons |
| Our other atlases | Lakeyas — Wikidata · CC0; © OpenStreetMap contributors · ODbL; GeoNames · CC BY 4.0; HydroLAKES · CC BY 4.0; NOAA OISST |
Every source and licence is on the data sources page.
The family
Do you prefer beaches, lakes, mountains, waterfalls, islands, rivers or canyons?
Same idea, other landscapes: field atlases built on open data, month by month, in seven languages.
 beaches
 Find your beach: sea temperature, sun and swimming month by month.Visit lakes
 Every lake on Earth: water temperature, ice, depth and the shore.Coming soonVisit
  mountains
 Every summit in 3D: summit weather, the 0 °C line, huts and trails.Visit
  waterfalls
 Every waterfall: height, flow month by month and when it roars.Coming soonVisit
  islands
 Every island from the sea up: size, sea temperature, ferries and 3D.Coming soonVisit
  rivers
 Every river from source to sea: the journey, the flow and the basin in numbers.You are here
 canyons
 Every canyon cut to scale: depth to the floor, rim and floor temperatures, trails and viewpoints.Coming soonVisit