River
Saskatchewan River
547 km from source to mouth · Canada.
 CanadaFlows into Lake Winnipeg
In numbers
Length
547km
Average flow
700m³/s
Basin
335,900km²
Drop
163m
from 378 m to 215 m
Country
1
The journey
From source to mouth
547 km of river and 34 stops on the way: 1 towns and cities on its banks, dams, bridges and the tributaries that feed it.
- 0 kmNorth Saskatchewan Riverat 378 m
- 0 kmNorth Saskatchewan Rivertributary
- 0 kmSouth Saskatchewan Rivertributary
- 140 kmTobin Lake261 km²
- 176 kmTorch Rivertributary
- 179 kmMcAuley Lake0.6 km²
- 184 kmCook Lake1.6 km²
- 185 kmBen Lake0.9 km²
- 226 kmCumberland Lake419 km²
- 237 kmEgg Lake16 km²
- 237 kmLittle Egg Lake2.2 km²
- 241 kmBig Lake8.1 km²
- 268 kmBarrier Lake5.4 km²
- 287 kmKakeyaskooskak Lake0.8 km²
- 310 kmLittle Minekwao Lake0.5 km²
- 327 kmPike Lake0.7 km²
- 332 kmPasquia Rivertributary
- 332 kmCarrot Rivertributary
- 333 kmThe Pas5,369 people
- 338 kmGrace Lake9.3 km²
- 354 kmMontreal Lake3.3 km²
- 354 kmMistasinnewuk Lake0.5 km²
- 359 kmMistikewapi Lake0.6 km²
- 364 kmLittle Kelsey Lake4.1 km²
- 369 kmKapakoskasewakak Lake0.9 km²
- 371 kmKelsey Lake28 km²
- 377 kmKapakwak Lake1.4 km²
- 378 kmKapiskwutunestekowoot Lake1.0 km²
- 382 kmJames Mason Lake0.5 km²
- 390 kmMiriam Baker Lake0.6 km²
- 392 kmPikwatchiasoykun Lake2.7 km²
- 395 kmClarence Watts Lake0.5 km²
- 396 kmElbow Lake1.1 km²
- 404 kmCorrigan Lake1.3 km²
- 505 kmCedar Lake2,504 km²
- 547 kmLake Winnipegat 215 m
Water level along the river (RiverATLAS; the height is exaggerated). Towns: GeoNames and Wikidata; bridges, dams and tributaries: Wikidata.
River in Canada
At the mouth it carries 700 m³/s on average: an Olympic pool every 3.6 seconds. It drops from 378 m to 215 m, 0.3 m per kilometre on average. Its basin covers 335,900 km², about the size of FI. 3.8 million people live in it. Highest water: from June to July; lowest: from December to March. It is heavily dammed: reservoirs can hold 151% of a year's flow.
Where to start
- The PasLargest city on its banks · 5,369 people
- The Pas Airport (YQD)Nearest airport with scheduled flights, 19 km from the cityCar hire at YTH airport (Thompson)Discover Cars · Affiliate link↗
- On the water3 ferry piers, marinas, boat rentals and boat ramps along the river (OpenStreetMap)
- Kayak and canoe6 put-ins and rapids mapped (OpenStreetMap)
- From June to AugustThe best months to visit
Saskatchewan River, month by month
Highest water: from June to July
Lowest water: from December to March. Freezing months (average below −4 °C): from November to March. Best months to visit: from June to August.
From about 530 m³/s in the lowest month to 650 m³/s in the highest. An estimate: the monthly flow is modelled from the lowest and highest months of WaterGAP (RiverATLAS, 1971–2000) and the rain and snow along the river (WorldClim). Dams change the real rhythm. The chip is the average air temperature; below it, the month's rain.
Plan the trip
Plan the trip: boat trips, a bed by the river, a car
Some links above are affiliate links: if you book through them we may earn a commission, at no extra cost to you. It never changes what the data on this page says.
The basin
Saskatchewan River: the basin in numbers
332,024 km² of land send their water to this river. This is what lives on it.
- 3.8millionpeople live in the basin
- 11/km²people per km²
- 787maverage altitude of the basin
- 446mmof rain a year (basin average)
- 1.5°Caverage air temperature
- 9%protected areas
- 4.7%covered by lakes
- 2%permafrost
- 28km³held in reservoirs
What covers the basin
- 32% Forest
- 37% Cropland
- 20% Pasture
- 1% Towns and cities
RiverATLAS (HydroATLAS v1.0, CC BY 4.0): land cover, people, protected areas, glaciers and dams over the whole basin upstream of the mouth.
Along the river
Saskatchewan River: what you find on the way
- 1WeirsBracken Dam
- 6Rapids
- 2Boat rampsboat launch dual, pickup docks
- 1Marinasvanity ventures
From OpenStreetMap, within 2.7 km of the river. Not mapped is not the same as not there.
Cross-checked with our atlases
Saskatchewan River in our other atlases
What our sister atlases know about the waterfalls on this river, the lakes it flows through, the beaches at its mouth, the mountains where it rises and the islands off its mouth.
 28lakes on its wayLakeyas
Lakes and reservoirs (28)
Lakes it flows through, by Lakeyas
- Tobin Lakekm 163261km²
- Cumberland Lakekm 265419km²
- Egg Lakekm 27716km²
- Big Lakekm 2828.1km²
- Grace Lakekm 3959.3km²
- Kelsey Lakekm 43428km²
- Elbow Lakekm 4641.1km²
- Cedar Lakekm 5912,504km²
20 more on LakeyasLakeyas is coming soonOpen Lakeyas ↗
From space
The source and the mouth, seen from orbit
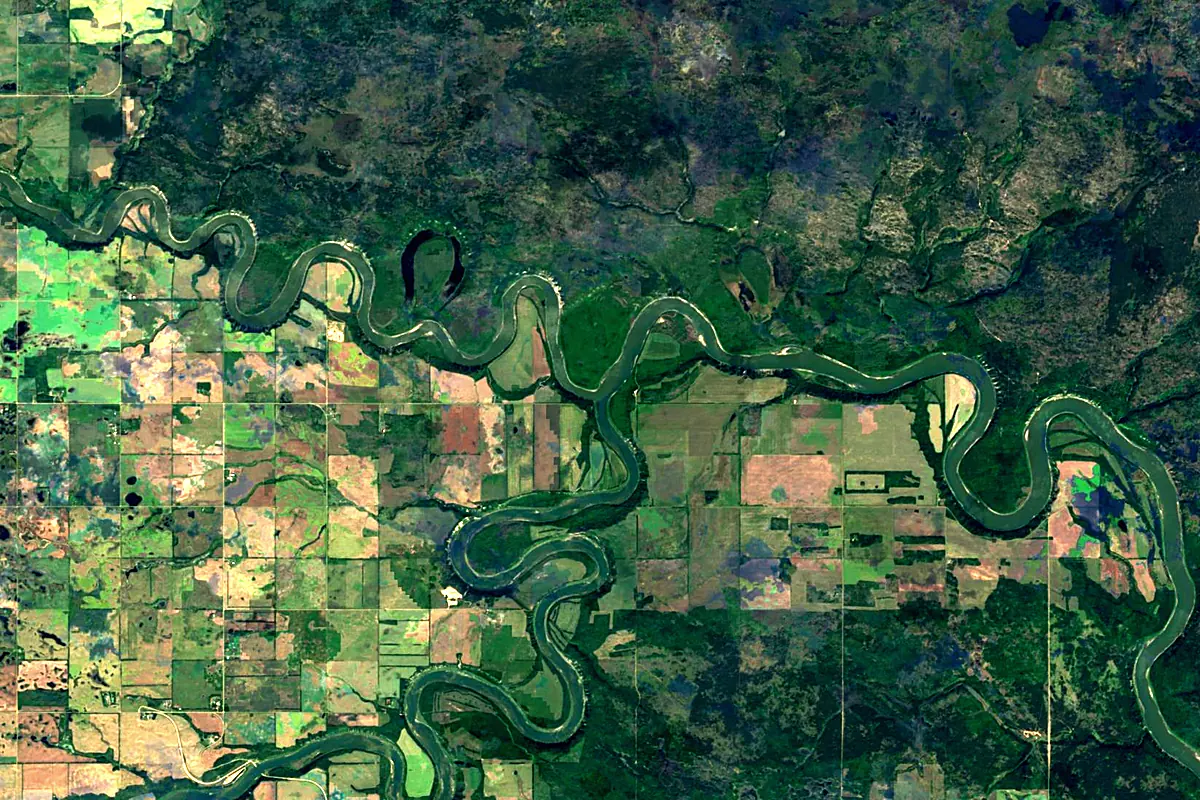
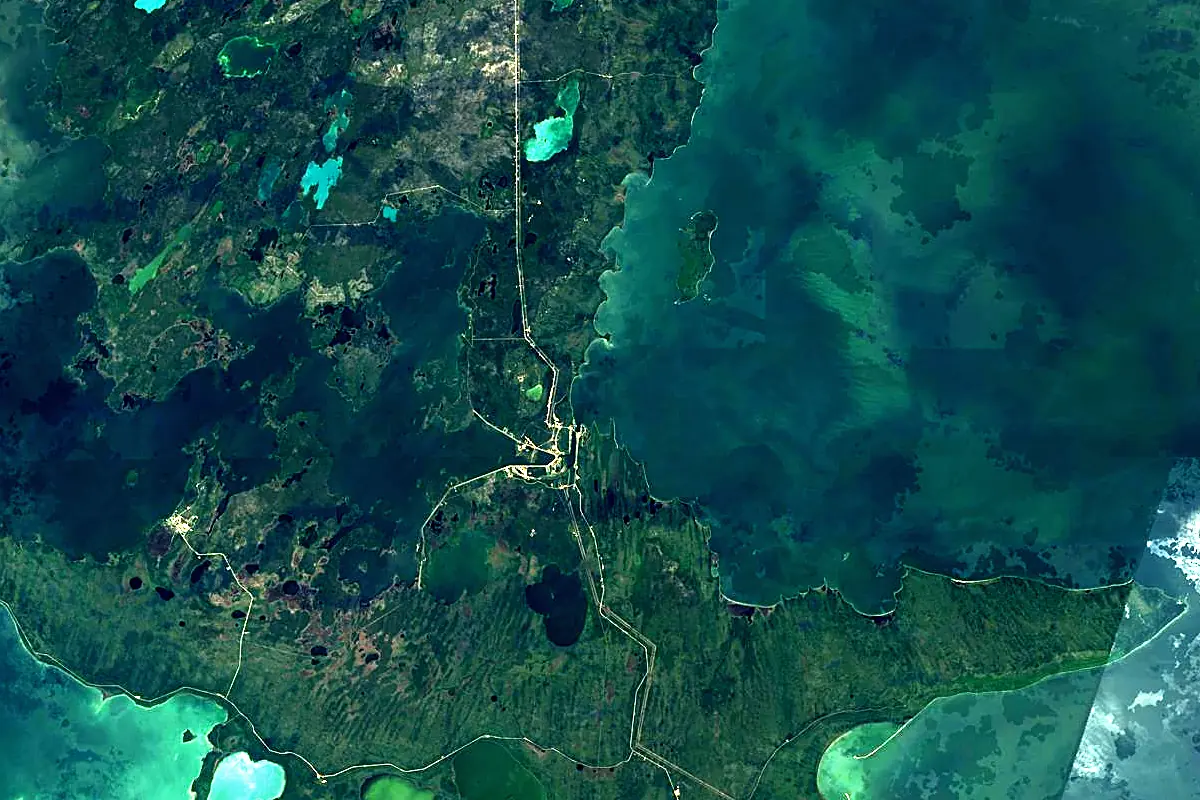
Sentinel-2 cloudless 2016 by EOX IT Services GmbH (contains modified Copernicus Sentinel data 2016), CC BY 4.0. The glowing line is the river as drawn by RiverATLAS.
Tributaries
Where it flows, and what flows into it
Tributaries (6)
Canada1,380 km240 m³/sjoins at km 0South Saskatchewan RiverCanada1,000 km250 m³/sjoins at km 0Also: Carrot River, Sturgeon-weir River, Torch River, Pasquia River
In the same basin
Canada644 km2,800 m³/sRed River of the NorthCanada890 km260 m³/sAssiniboine RiverCanada1,275 km45 m³/sBow RiverCanada587 km130 m³/sRed Deer RiverCanada801 km70 m³/sOldman RiverCanada445 km95 m³/sWinnipeg RiverCanada298 km950 m³/sQu'Appelle RiverCanada743 km14 m³/sSouris RiverCanada1,240 km60 m³/sNearby
Rivers nearby
Canada890 km260 m³/s353 km awayWinnipeg RiverCanada298 km950 m³/s344 km awayQu'Appelle RiverCanada743 km14 m³/s339 km awayNorth Saskatchewan RiverCanada1,380 km240 m³/s390 km awaySouth Saskatchewan RiverCanada1,000 km250 m³/s390 km awayAssiniboine RiverCanada1,275 km45 m³/s395 km awaySouris RiverCanada1,240 km60 m³/s395 km awayWhere these numbers come from
| Name, length, places | Wikidata (Q3047) · CC0 |
|---|---|
| Course, profile, basin | RiverATLAS v1.0 (HydroATLAS, Linke et al. 2019) · CC BY 4.0 — followed from the source to the mouth given by Wikidata |
| Flow | WaterGAP (RiverATLAS), 1971–2000 · CC BY 4.0 |
| Climate along the river | WorldClim (RiverATLAS), 1970–2000 · CC BY 4.0 |
| Towns, bridges, dams | Wikidata · CC0; GeoNames · CC BY 4.0 |
| Along the river | © OpenStreetMap contributors · ODbL |
| Images | EOX Sentinel-2 cloudless 2016 · CC BY 4.0; Wikimedia Commons |
| Our other atlases | Lakeyas — Wikidata · CC0; © OpenStreetMap contributors · ODbL; GeoNames · CC BY 4.0; HydroLAKES · CC BY 4.0; NOAA OISST |
Every source and licence is on the data sources page.
The family
Do you prefer beaches, lakes, mountains, waterfalls, islands, rivers or canyons?
Same idea, other landscapes: field atlases built on open data, month by month, in seven languages.
 beaches
 Find your beach: sea temperature, sun and swimming month by month.Visit lakes
 Every lake on Earth: water temperature, ice, depth and the shore.Coming soonVisit
  mountains
 Every summit in 3D: summit weather, the 0 °C line, huts and trails.Visit
  waterfalls
 Every waterfall: height, flow month by month and when it roars.Coming soonVisit
  islands
 Every island from the sea up: size, sea temperature, ferries and 3D.Coming soonVisit
  rivers
 Every river from source to sea: the journey, the flow and the basin in numbers.You are here
 canyons
 Every canyon cut to scale: depth to the floor, rim and floor temperatures, trails and viewpoints.Coming soonVisit